Category: Power BI

Notes on Power BI

Customer Segmentation based on Sales by Calculated Table

Customer တွေကို age group လိုမျိုး master data က အချက်တွေကို အခြေခံပြီး segmentation ခွဲတာက table ထဲမှာ calculated column ထည့်တာနဲ့ ခွဲလို့ ရပေမဲ့ Customer တစ်ယောက်အနေနဲ့ တစ်ကြိမ်ထက်ပိုပြီး ပါနေနိုင်တဲ့ Sales transaction table Sales ပေါ် အခြေခံပြီး ခွဲမယ်ဆိုရင်တော့ Sales Table မှာ calculated column Read more Customer Segmentation based on Sales by Calculated Table
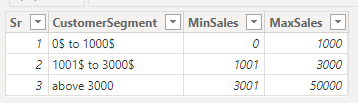
Customer Segmentation based on Sales by DAX

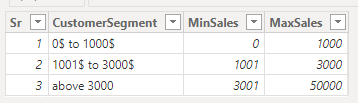
Sales ပေါ်အခြေခံတဲ့ Customer segmentation group ကို DAX measure သုံးပြီးလဲ ခွဲလို့ ရပါတယ်။ DAX measure နဲ့ ခွဲမယ်ဆိုရင် table ထဲမှာ calculated column လိုမျိုး ထည့်ထားဖို့ မလိုပဲ Model Relationship တွေလဲ လုပ်ဖို့ မလိုပဲ formula ကနေပဲ အဖြေထုတ်လို့ ရနိုင်ပါတယ်။ Step 1. Sales level ကို သတ်မှတ်တဲ့ table Read more Customer Segmentation based on Sales by DAX

Fiscal Year Date Table in Power BI (From Excel to Power Query : M Code)

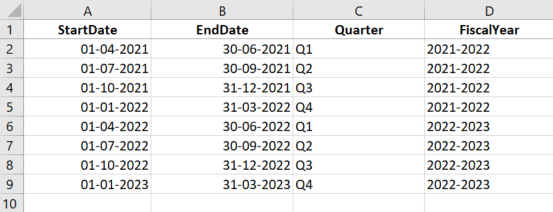
Power BI report တွေ အတွက် Fiscal Calendar ကို Excel မှာ အရင်ပြင်ပြီး Power Query Editor (M Language) ကိုသုံးပြီး တည်ဆောက်တဲ့ ပုံစံ အဆင့်ဆင့်ကို လေ့လာပါမယ်။ အဆင့် ၁ : Excel မှာ နှစ် တနှစ်လုံးအတွက်ပဲ ဖြစ်ဖြစ်၊ Quarter တစ်ခုချင်းစီအတွက် ပဲ ဖြစ်ဖြစ် ကိုယ်လိုအပ်တဲ့ ပုံစံနဲ့ အရင်ပြင်ထားရပါမယ်။ ခု Read more Fiscal Year Date Table in Power BI (From Excel to Power Query : M Code)

Fiscal Year Date Table in Power BI

BI Report တွေဆွဲတဲ့ အချိန်မှာ Date က မရှိမဖြစ်လိုအပ်တဲ့ Dimension ဖြစ်ပြီး လုပ်ငန်းတစ်ခုနဲ့ တစ်ခုမှာ Fiscal Year ကို သတ်မှတ်ပုံခြင်း ကွာခြားတဲ့ အပေါ်မူတည်ပြီး date table ကို တည်ဆောက်ရပါတယ်။ ပုံမှန် Jan ကနေ Dec Fiscal Year သုံးတဲ့ လုပ်ငန်းတွေအတွက်ဆိုရင် တော့ အခက်အခဲမရှိပေမဲ့ Apr to Mar, Jul to Jun Read more Fiscal Year Date Table in Power BI

Components in BI Project

There are 3 important component in business intelligent project. 1. Facts : Business events to analyze. e.g. Invoices, Stocks Movements, Purchase, Good Receipts, Payments, etc. business မှာ analyze လုပ်ဖို့လိုအပ်တဲ့ လုပ်ငန်းဆောင်ရွက်ချက် (Business Event) တွေကို Fact လို့ ခေါ်ပါတယ်။ ဥပမာအားဖြင့် Read more Components in BI Project

Context in DAX

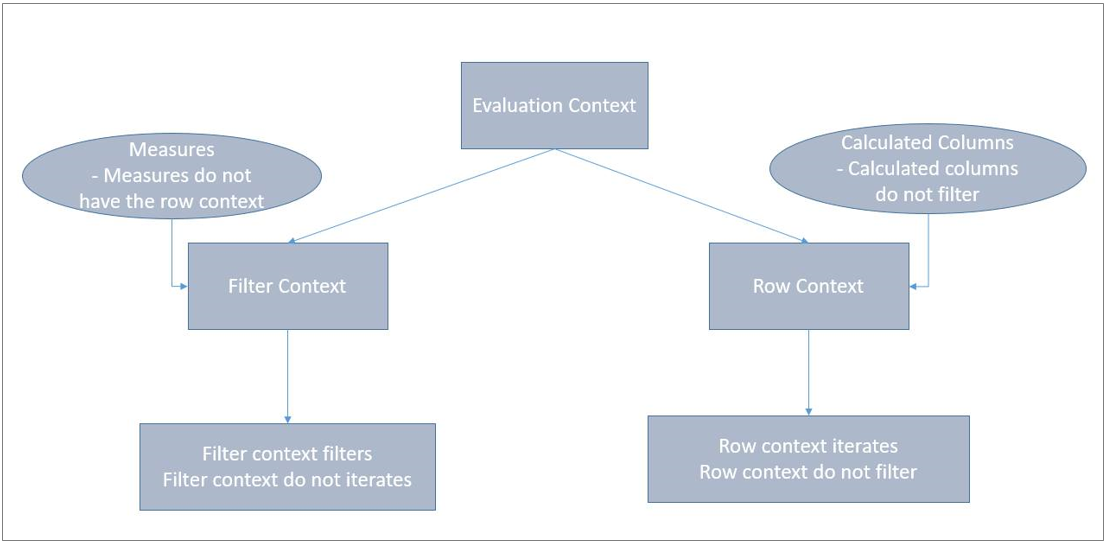
Power BI ရဲ့ Evaluation Context မှာ Filter Context နဲ့ Row Context နှစ်မျိုးရှိပါတယ်။ Measures တွေမှာ Filter Context ပဲ ရှိပြီး Row Context မရှိပါ။ Calculated Columns တွေမှာကတော့ Row Context ပဲ ရှိပြီး Filter Context မရှိပါ။ Filter Context က Aggregation တွေ ပြုလုပ်တဲ့အချိန်မှာ ရွေးချယ်ထားတဲ့ filter Read more Context in DAX

Secret of "Calculate" in DAX

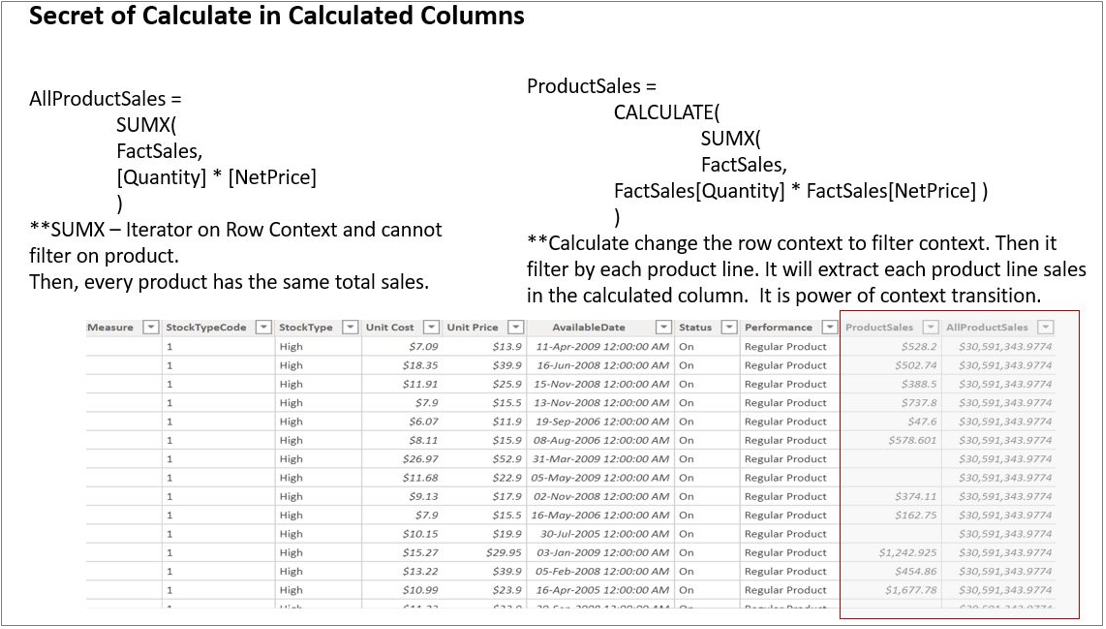
Calculated Columns တွေမှာ Aggregation formula ရေးကြတဲ့ အချိန်မှာ Filter Context မရှိတဲ့ အတွက် ပုံမှာပြထားတဲ့ AllProductSales formula ရဲ့ အဖြေဟာ table တစ်ခုလုံးရဲ့ ပေါင်းလဒ် ဖြစ်နေပါတယ်။ ဒီလို ဖြစ်နေတဲ့ row context ကို filter context ဖြစ်လာအောင် ပြောင်းချင်တယ် ဆိုရင် "CALCULATE" command ကို သုံးပြီး Read more Secret of "Calculate" in DAX

Outlet Distirbution Map in Power BI

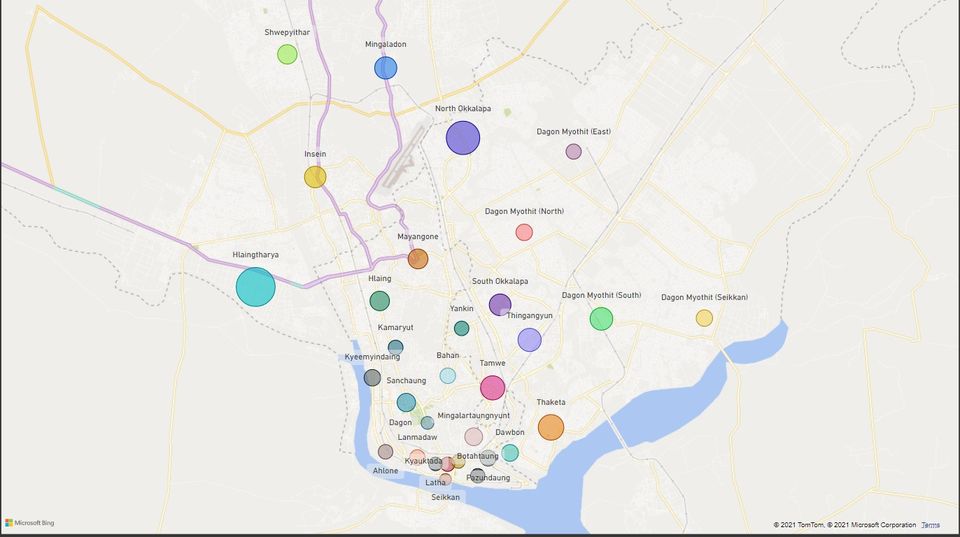
Outlet Distribution Product Distribution, Retail Market Survey စတဲ့ လုပ်ငန်းများမှာ ကိုယ့် target မြို့နယ်အလိုက် ဆိုင်တွေရဲ့ information၊ ကုန်ပစ္စည်းအမျိုးအစား availability တွေကို ကောက်ယူပြီးတဲ့ အချိန်မှာ လက်ထဲက Raw data ကို actionable information ဖြစ်အောင် ထုတ်ယူဖို့ လိုပါတယ်။ ပုံမှန် tabulation Read more Outlet Distirbution Map in Power BI

What to prepare yourself before learning Power BI

ကျွန်မ Power BI သင်ပါတယ်။ သင်တန်းအစတိုင်းမှာ ဒီသင်တန်းပြီးတာနဲ့ Professional Dashboard တွေ ဆွဲနိုင်မှာ မဟုတ်ဘူးဆိုတာရယ်၊ Power BI ဟာ ခက်ပါတယ် ဆိုတာရယ်၊ အချိန်ပေးလေ့ကျင့်ဖို့ရယ်၊ သင်တန်းပြီးရင်လဲ ဆက်ပြီးလေ့လာဖို့ လိုအပ်တယ် ဆိုတာ အမြဲပြောပါတယ်။ လူတွေကို false hope မပေးချင်လို့ပါ။ Read more What to prepare yourself before learning Power BI